Nutrient Management for Fruit Production and Beyond: Deficiencies, Excesses, and Current Technologies
Author: Evan Lentz
Evan.lentz@uconn.edu
Reviewer: Shuresh Ghimire & Mary Concklin, UConn Extension
Publication EXT174 | December 2025
https://doi.org/10.61899/ucext.v2.174.2025
Introduction
Adequate nutrient management is essential in all fruit production systems. The availability of essential plant macro- and micronutrients largely influences the growth and development of plants, fruit yield, and subsequent fruit quality. Nutrient availability also impacts the severity of abiotic and biotic stress.
The goal of a well thought-out nutrient management plan is to maximize output, while avoiding system deficiencies and excesses. Although plant nutrition has been exhaustively studied, and its importance thoroughly communicated, the practice of nutrient management is still considered challenging at best, even by experienced growers.
This fact sheet explores some of the common complicating factors in nutrient management, the tools available to growers, and available resources.
Sources of Deficiency
True System Deficiency
This is the most straightforward type of deficiency: there is not enough of a given nutrient available to the plant. To solve this problem, supplemental nutrition needs to be added to the system.
Effect of pH on Availability and Uptake
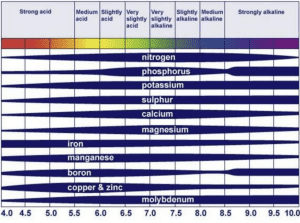
This issue is twofold: availability and uptake. The image below shows some of the changes in availability of essential nutrients across pH ranges (Figure 1). This means that for any crop, nutrients vary in availability depending on the soil’s pH. In addition, each crop has its own preferred pH range at which it performs best. This includes the ability of a plant to uptake nutrients from the soil environment.
Plants grown out of their preferred pH range will have difficulty acquiring essential nutrients, even if the specific nutrient is available in the system. To solve this problem, the soil pH needs to be raised (with lime) or lowered (with sulfur) to match the preference of the crop.
Water Status
Essential nutrients are taken up from the soil environment in different ways: mass flow, diffusion, and root interception (Figure 2). Nutrients that move by mass flow rely on being dissolved in water and moved to plant roots to be absorbed. Nutrients that are taken up via diffusion are moved to the surface of roots across a concentration gradient (from an area of higher concentration to an area of lower concentration). These nutrients are first taken up from directly around the root surface; then these nutrients will move from the surrounding area into the range of the root surface where they will be taken up again. This is a continuous process.
Finally, uptake via root interception occurs as a result of roots growing through the soil environment until they reach the nutrient. The water status in any system will influence the uptake of nutrients via these various mechanisms.
In drought conditions, lack of water inhibits the movement of nutrients in the soil environment. Likewise, oversaturated soils will inhibit the roots’ ability to uptake nutrients. To solve this problem, supplemental irrigation or drainage is recommended to maintain adequate water status throughout the entire growing season.
| Nutrient | Mass Flow | Diffusion | Root Interception |
| Nitrogen | X | ||
| Phosphorus | X | ||
| Potassium | X | X | |
| Calcium | X | X | |
| Magnesium | X | X | |
| Sulfur | X | X | |
| Boron | X | ||
| Copper | X | ||
| Iron | X | X | X |
| Maganese | X | X | |
| Zinc | X | X | X |
| Molybdenum | X |
Figure 2. Transport processes for various plant nutrients (Cornell University, 2010)
Induced Deficiency
Induced deficiencies are a result of an overapplication of another nutrient, in excess of what is required for growth. Below is a table showing which nutrients (when in excess) serve as the cause for various induced deficiencies (Figure 3). The mechanism for induced deficiencies can vary. The first mechanism for an induced deficiency results from the relative required amounts of plant nutrients and system limitations.
For example, nitrogen is the most limiting nutrient in any system, as it is needed in largest quantities. A plant will grow optimally until it uses up all the available nitrogen. If there is no shortage of nitrogen, optimal growth will continue until there is no more available phosphorus, which is the nutrient required in the second largest quantity. In this way, overapplication of nitrogen causes excessive growth, utilization of all available phosphorus, and subsequently a phosphorus deficiency.
The second mechanism for induced deficiency is nutrient antagonism. This is largely due to similarities in the properties of some nutrients. For example, potassium, magnesium, and calcium have a well-documented antagonistic relationship. This is due to the similarity in size and charge of their ions, which affects nutrient uptake and the like.
| Nutrient In Excess | Induced Deficiency |
| Nitrogen | Potassuim |
| Potassium | Nitrogen, Calcium, Magnesium |
| Phosphorus | Potassium, Copper |
| Sodium | Potassium, Calcium, Magnesium |
| Calcium | Magnesium, Boron |
| Magnesium | Calcium, Potassium |
| Iron | Manganese |
| Manganese | Iron |
| Copper | Iron |
Figure 3. Nutrient excesses and associated induced deficiencies (Concklin, 2021)
Challenges with Excesses
There are many challenges associated with excessive nutrition beyond inducing a deficiency of another plant nutrient. Below is a summary of some challenges associated with overfertilization in fruit production systems
- Environmental Pollution: Excessive use of nitrogen fertilizers can lead to high levels of nitrate in the soil, which can leach into groundwater and find its way into rivers and streams. Nitrates tend to persist for extended periods of time. The same can be said for phosphorus. Once these nutrients find their way into bodies of water, they can trigger algal blooms, proliferation of potentially toxic algae, habitat degradation, and even fish kills due to hypoxic conditions;
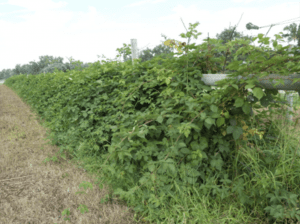
- Reduced Crop Productivity and Quality:In particular, nitrogen can increase excessive vegetative growth, which can cause shading, negatively impacting flower bud development, fruit set, and fruit quality, including color. Excessive vegetative growth can also lead to delayed fruit development, small fruit size, and even soft fruit (FIGURE 4);
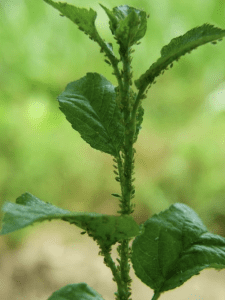
- Increased Susceptibility to Pests and Diseases: Overfertilization and subsequent excessive growth poses a problem for pest management by decreasing air flow and sunlight penetration, creating the perfect environment for both insects and pathogens. Excessive vegetative growth leads to the development of soft, succulent tissues, which serve as an entry point for disease such as Fireblight, and feeding sites for insects like aphids (FIGURE 5);
- Economic Inefficiency: Lastly, but certainly not least, is the economic impact of overfertilization. As the name suggests, these are applications more than what is needed which means waste.
Producing fruit is an already high-input endeavor. Overfertilization not only wastes money on the front end for fertilizer you do not need, it can also require corrective action including additional pesticide applications to control encouraged pests and diseases.
Managing overfertilized soils can be challenging, certainly more so than deficient soils. The University of Massachusetts’ Soil and Plant Nutrient Testing Laboratory has a great resource available entitled, Corrective Measures and Management of Over-Fertilized Soils, outlining some considerations and practices to manage overfertilized soils. Below is a summary.
Here are some corrective measures:
- Re-check your sampling method to ensure the results that you received are accurate before proceeding;
- Assess plant health to determine the impact of excessive nutrient levels on growth and development. If tolerant of high nutrient levels, further corrective action might not be warranted;
- Leach out salts. Leaching out of soluble nutrients requires the use of irrigation water to remove applied nutrients;
- Utilize cover crops. Cover crops can help to absorb and remove excess nutrients from the soil.
- Monitor plant health by testing your soil and plant tissues annually. Do not apply additional nutrients until needed.
Soil Testing & Limitations
Soil tests should be conducted prior to planting and regularly every two to three years after planting. If you are putting down a large amount of any material, such as limestone to correct a large discrepancy, soil tests should be performed more frequently.
Otherwise, things don’t change that quickly in the soil environment and sampling more than every three years is wasteful. Below is a breakdown of the soil testing process, including sampling instructions, what is included in the report, and the limitations.
How to Collect and Submit a Soil Sample (copied from UConn Soil Nutrient Analysis Laboratory):
- Late October or early November is usually the best time to sample, but samples may be taken at any time during the year, unless the soil is frozen;
- Areas differing in topography, drainage, soil texture, manure additions, soil organic matter content (light versus dark colored) or intended crop usage should be sampled and tested separately;
- Under no circumstances should samples represent areas larger than 15 acres;
- Avoid sampling unusual spots such as former sites of manure, compost, or mulch piles and areas where limestone or fertilizer has been spilled in previous years;
- It is imperative that the soil sample represents accurately the entire sampling area. To obtain a representative sample, take a uniform core or thin slice from at least 12 evenly distributed places within a given area. Sample the plow layer, usually the top six to eight inches. Put the slices or cores in a clean container and thoroughly mix them. One cup of this soil mixture constitutes the soil sample. Transfer this one cup into a zipper lock bag and seal;
- Fill out and print the appropriate questionnaire and place it along with your sample(s) and a check payable to UConn ($15.00/sample for standard nutrient analysis) in a sturdy mailing envelope or box. If multiple samples are being sent at one time, be sure to label the outside of each bag with a sample name and/or number. If 10 or more samples are submitted at one time, see information on our multi-sample discount policy for commercial growers;
- Send samples to: UConn Soil Nutrient Analysis Laboratory, 6 Sherman Place, Unit-5102, Storrs, CT, 06269-5102.
What is Provided in Your Results
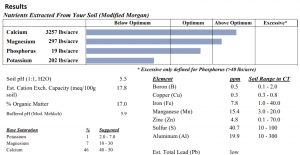
The results you receive from the UConn Soil Nutrient Analysis Laboratory contain a wealth of targeted information. Below is a summary of the information provided (Figure 6).
- Macronutrients: Modified Morgan extractable amounts (lbs/acre) of calcium, magnesium, phosphorus, and potassium are provided in an easy-to-read format, with important designations noting if your soil falls below optimum, within optimum, above optimum, or into excessive range;
- Micronutrients: Modified Morgan extractable amounts (ppm) of boron, copper, iron, manganese, zinc, sulfur, and aluminum are provided, along with the typical ranges of each found in Connecticut soils. NOTE: These are typical ranges and are not standards. Therefore, they are not useful in making management decisions;
- Soil pH: The soil pH is a direct measure of the acidity or alkalinity of your soils. The soil pH influences the growth and development of your crop because it determines the availability of all nutrient elements. It is a true measure of the concentration of hydrogen ions in the soil environment;
- Buffered pH: Buffered pH is essentially a measure of how easily the pH of your soil will respond to additions of limestone or sulfur. This buffered pH is also called the residual or reserve acidity of the soil. The lower the buffered pH, the higher the buffering capacity, meaning the soil has a greater ability to resist increases in soil pH from the addition of limestone. The opposite is true for lowering the soil’s pH with sulfur. This allows for targeted recommendations of limestone and sulfur;
- Organic Matter: Organic matter (%) is provided when requested for an extra fee at the UConn Soil Nutrient Analysis Laboratory. Soil organic matter plays an important role in supplying nutrients (mainly nitrogen), contributes to cation exchange capacity, and improves soil structure. Although some crops do have a preference for organic matter (%), this is a direct measure of overall soil health;
- Estimated Cation Exchange Capacity: Estimated Cation Exchange Capacity (CEC) is a measure of plant nutrient availability and retention in the soil. It is not an absolute value, but rather the overall potential of the nutrient supply. This is influenced by nutrient exchange that occurs on the surfaces of clay particles, organic matter and plant roots. Figure 7 demonstrates the relationship between soil texture and CEC;
- Base Saturation: Base Saturation is the percentage of the CEC occupied by base cations (Ca, Mg, K, Na). This is closely related to pH: as base saturation increases, pH increases. This measure also provides insight into why some soils with high levels of base cations, such as calcium, may never be lowered past a certain pH. The lab also provides a suggested base saturation range for each measured cation;
- Estimated Total Lead: Finally, the lab provides an estimated level of lead to determine if there are any potential health concerns;
- Recommendations: At the bottom of the results page, your customized recommendations begin. The recommendations will be based on the type of crop you noted on your soil sample submission sheet. Recommendations for limestone, nitrogen, phosphorus, and potassium are provided in pounds per acre. In the following “Comments” section, details on the recommendations are provided, including directions for making split applications and applying sulfur. This section also provides general recommendations for nutrient management, including tissue testing. References and resources for further information are provided at the end.
The goal of these results and accompanying recommendations is to take the guess work out of nutrient management decisions. Simply following the exact recommendations provided and getting your soils re-tested about every three years will ensure thoughtful soil and crop management.
However, there are limitations to the insights provided in the soil test results. These tests only tell us what is available in the soil. As discussed above, there are other factors affecting the nutrient status of your crop including water status and potential induced deficiencies. To gain a better understanding of the nutrient status of your plants, annual tissue testing is recommended in tandem with regular soil tests.
| Soil Texture | Typical CEC (meg/100 g soil) |
| Sands | 3-5 |
| Loams | 10-15 |
| Silt Loams | 15-25 |
| Clay and Clay Loams | 20-50 |
| Organic Soils | 50-100 |
Figure 7. The relationship between soil texture and CEC (Culman et al., 2019)
Plant Tissue Testing
Tissue testing is currently the best tool available to producers in providing an accurate depiction of the nutrient status of crops. Tissue tests tell you exactly what amounts of each nutrient are within the plants. This considers not only to nutrient availability, but also nutrient uptake and distribution in the plant. Results from tissue tests can reveal limitations beyond simple system deficiencies and pH-restricted nutrient uptake.
How to Collect and Submit a Tissue Sample(copied from UConn Soil Nutrient Analysis Laboratory):
Sampling instructions will vary between crop types, however, there are some general sampling guidelines to follow.
- Sample an average of 10-30 plants of one variety from a representative area;
- If there is a plant growth problem, submit a sample from the problem area along with a sample where normal growth is occurring;
- Collect the appropriate number of leaves/petioles/clippings per sample. Contact the UConn Soil Nutrient Analysis Laboratory for specific collection information for various plant species;
- If plant samples have soil, fertilizer, dust, or spray residues, they will need to be cleaned. Try brushing with a soft brush. For persistent residues, wash leaves/petioles with a dilute (phosphate-free) dishwashing detergent in tap or distilled (preferred) water quickly (less than one minute). Rinse well, shake excess water from, and air dry at room temperature on paper towels or other clean, absorbent surface. Do not let plant samples sit in water as nutrients will leach out;
- Place dried leaves in a clean paper bag and submit to the UConn Soil Nutrient Analysis Laboratory along with the questionnaire and payment. Fresh, rinsed samples may also be brought directly to the lab or shipped overnight to UConn Soil Nutrient Analysis Laboratory, 6 Sherman Place, Unit-5102, Storrs, CT, 06269-5102.
Specific Guidelines for Fruit Producers
Sampling times will vary between crop types. This is due to differences between specific crop types as well as the stability of nutrients at different times across the growing season (Figure 8).
- Apples, apricots, and cherries should be sampled during the summer. Collect 50 of the most recently matured leaves from new growth;
- Pears and plums should be sampled during the summer. For pears, collect 50 midshoot leaves from new growth. For plums, collect 25 midshoot leaves from new growth;
- Peaches and nectarines should be sampled during fruit set in the spring. For both, collect 25 midshoot leaves from new growth;
- Strawberries should be sampled during bloom. Collect 25 leaves from new growth;
- Blueberries should be sampled during the summer. Collect 75 of the most recelty matured leaves;
- Raspberries should be sampled 2-3 weeks after harvest. Collect 50 leaves from the midshoot section of primocanes. Primocanes are one-year-old canes;
- Table grapes and wine grapes should be sampled during bloom. Collect 50 petioles from leaves opposite flower clusters. Wine grapes can also be sampled during veraison. Collect 50 petioles from leaves opposite fruit clusters. Petioles are leaf stems. Veraison is when the fruit begins to turn color.
Sampling instructions for other crops including vegetables, turfgrass, Christmas trees, and greenhouse crops can be found on UConn's soil testing website.
| Decreases (higher concentrations early) | Mostly Stable | Increases (higher concentrations later) |
| Nitrogen | Magnesium | Calcium |
| Phosphorus (slight) | Iron | Manganese |
| Potassium | Copper | |
| Boron |
Figure 8. Nutrient concentration as affected by time throughout the growing season (Stile and Reid, Cornell)
What is Provided in Your Results
The results from tissue analysis will look somewhat different than those from your soil test. The results will look similar to the chart below (Figure 9). Actual amounts of all macro- and micronutrients will be provided along with the sufficiency ranges for each. This will allow you to easily identify any issues.
However, there are no recommendations provided for tissue analysis. It will be up to you to contact a local Extension professional to come up with an action plan.
The reason that recommendations are not provided is that there are many factors that affect the internal nutrient content of plants, as have been outlined above. As you work with your Extension professional to analyze results of both the tissues analysis as well as your soil tests, accompanied by an evaluation of your cultural management, recommendations can be made.
| Plant Nutrient | Sample Results | Sufficiency Range |
| Nitrogen (N) % Dry Weight | 1.94 | 1.7 - 2.1 |
| Phosphorus (P) % Dry Weight | 0.13 | 0.10 - 0.40 |
| Potassium (K) % Dry Weight | 0.52 | 0.40 - 0.65 |
| Calcium (Ca) % Dry Weight | 0.56 | 0.30 - 0.80 |
| Magnesium (Mg) % Dry Weight | 0.18 | 0.15 - 0.30 |
| Boron (B) PPM Dry Weight | 78.00 | 30 - 70 |
| Copper (Cu) PPM Dry Weight | 2.20 | 5 - 20 |
| Iron (Fe) PPM Dry Weight | 90.30 | 60 - 200 |
| Maganese (Mn) PPM Dry Weight | 211.60 | 50 - 350 |
| Molybdenum (Mo) PPM Dry Weight | 0.0 | No Data |
| Zinc (Nn) PPM Dry Weight | 11.20 | 8 - 30 |
| Non-Essential Elements | ||
| Sodium (Na) % Dry Weight | 0.01 | No Data |
| Aluminum (Al) PPM Dry Weight | 95.60 | 120 - 160 |
| Lead (Pb) PPM Dry Weight | 0 | No Data, Ideal Value Would Be 0 |
Figure 9. Example tissue analysis results table for blueberries (UConn SNAL)
Limitations
Even though tissue analysis is the best tool we currently have to evaluate the nutrient status of plants, it is not without its limitations. The primary limitations with tissue sampling are time and money. First, results can take up to and beyond two weeks to receive, depending on how busy the lab is. Second, is the cost. The per sample cost for tissue analysis is $30.00 per sample. Since it is suggested that variety- and site-specific samples be taken, the cost of analyzing an entire operation can get expensive.
The Future of Nutrient Management
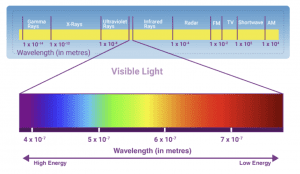
To address the limitations of our current nutrient management technologies, the University of Connecticut has been developing novel tools for whole-farm nutrient analysis. This six-year, grant-funded project utilizes unmanned aerial vehicles (UAV’s) or drones equipped with high powered multi-spectral sensors (Figure 10). These sensors capture a wide range of spectral data, far beyond what is observable with the human eye (Figure 11). This includes wavelengths in the infrared and ultra-violet ranges to name a few. This spectral data can be used to determine if nutrient deficiencies or excess exist within a given system. Currently, predictive models are being developed to provide real-time feedback on plant nutrient status on a whole-farm scale.

This technology has the potential to vastly improve the current nutrient management practices in use. First, the real-time feedback would eliminate the lag-time between collecting a sample and getting results or recommendations to then act upon.
One of the biggest limitations of traditional testing methods is that any corrective action taken is only going to impact next year’s crop. There is currently no protocol for addressing nutrient challenges in-season, in hopes of impacting the current year’s crop.
Next, this technology has the potential to address the challenge of cost. Since the technology address nutrition on a whole farm scale, hundreds of acres can be covered in just a few hours. This real-time feedback, combined with foliar nutrient spray applications, could work to correct nutrient deficiencies and improve the current year’s crop.
Although this technology is still a few years away from implementation, its efficacy is currently being evaluated.
For more information of this technology, please visit the interactive storyboard.
Resources
Cornell University. 2010. Competency Area 2: Basic Concepts of Soil Fertility. Northeast Region Certified Crop Adviser Study Resources. https://nrcca.cals.cornell.edu/nutrient/CA2/CA0209.php
Cuman, et al. 2019. Calculating Cation Exchange Capacity, Base Saturation, and Calcium Saturation. Ohio State University Extension. ANR-81. https://ohioline.osu.edu/factsheet/anr-81
Jakobsen, S. T. 1993. Interaction between Plant Nutrients: III. Antagonism between Potassium, Magnesium and Calcium. Acta Agriculturae Scandinavica, Section B — Soil & Plant Science, 43(1), 1–5. https://doi.org/10.1080/09064719309410223
Pettinelli and Ghimire. 2021. Soil pH and Management Suggestions. UConn Extension Soil Nutrient Analysis Laboratory. https://soiltesting.cahnr.uconn.edu/soil-ph-and-management-suggestions/
Smith, et al. 2017. Corrective Measures and Management of Over-Fertilized Soils. University of Massachusetts Extension. https://ag.umass.edu/soil-plant-nutrient-testing-laboratory/fact-sheets/corrective-measures-management-of-over-fertilized
Weinbaum, et al. 1992. Causes and Consequences of Overfertilization in Orchards. HortTechnology 2(1) (January 1992): 112–132. https://doi.org/10.21273/HORTTECH.2.1.112b.
The information in this document is for educational purposes only. The recommendations contained are based on the best available knowledge at the time of publication. Any reference to commercial products, trade or brand names is for information only, and no endorsement or approval is intended. UConn Extension does not guarantee or warrant the standard of any product referenced or imply approval of the product to the exclusion of others which also may be available. The University of Connecticut, UConn Extension, College of Agriculture, Health and Natural Resources is an equal opportunity program provider and employer.